When we started selling our Cloud telephony platform, we had very little idea of what metrics to concentrate on. So we just built the product and winged it 🙂
Now after 4 years, we have a pretty good command of what metrics to concentrate on. What works, what doesn’t. Which channels are better and which sales techniques work. We learnt this the hard way and by reading blogs by David Skok, Jason Lemkin and Tom Tunguz. They did provide some benchmarks to go on. But nothing specific to the circumstances in India.
Looking around, we realize that we are in a very special situation. Since we concentrated only on India for our product, we have SaaS revenue from only Indian customers. This gives a nice opportunity to start creating some benchmarks.
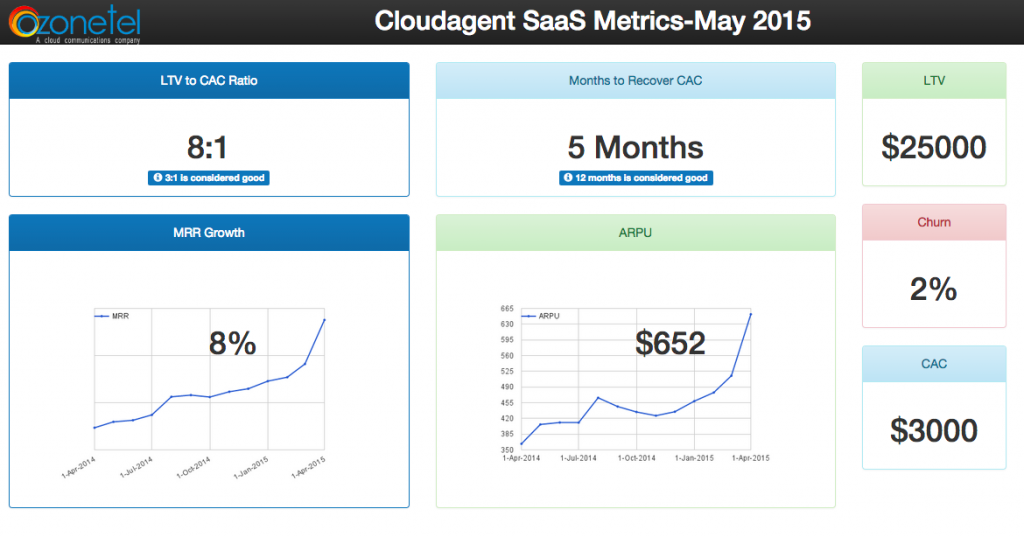
Unfortunately there are not many hard numbers out there which can help new India B2B SaaS companies. So in the interest of transparency, we are sharing the SaaS metrics for our Cloudagent product. Some important points:
- Cloudagent is a contact center product. It is a high touch point product with a big sales cycle.
- All revenues and numbers are based only on Indian customers. We are in fact one of the very few companies out there serving only Indian customers :). May not hold true this year though.
- We are doing this as an experiment. Looking at how it goes, we will open up more and more of our numbers, similar to what Buffer did. So be good to us 🙂
- None of the metrics are set in stone. This is what works for our business and we are all learning. Please comment here our mail me at chaitanya@ozonetel.com or follow me @nutanc on twitter. Would love to hear your thoughts.
- We will be updating this page on the 10th of every month. So please check back in to see how our business is doing 🙂
Building a SaaS machine is hard. But once it starts rolling, it is almost like clockwork. The numbers presented are what helped us to fine tune our process. Looking at isolation, each number may not make sense. But the way they all interact to run the SaaS machine is what is most important.
Since a lot of people were asking for the base spreadsheet used to calculate these metrics, I have created a template in Google docs. Feel free to download and use it as you see fit. You can just modify the “blue” numbers with your own numbers and see your metrics. Base Spreadsheet


