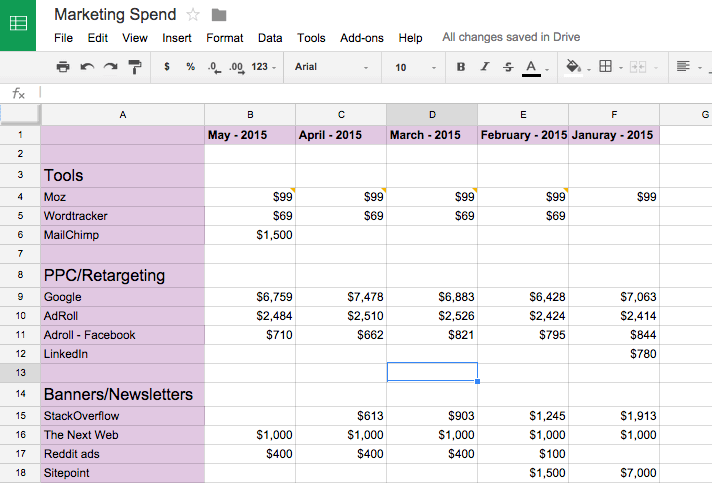
I moved into a product role recently but for the majority of my startup life, I was in marketing. One of the things I always had lacking in my toolbox was a simple expense tracker. I looked around a lot but the best option was what I was already using and wanted to move on from — Google Sheets.
What’s wrong with a spreadsheet?
Google Sheets is a great way to record marketing spends compared to complicated expense management modules built inside even more complex solutions. It’s fast, everything is one place, everyone’s familiar with it, and there’s no easier way to collaborate than Google Sheets.

But every time I shared the sheet with someone else to add spends made by them or their team, I was scared that something will go wrong. They might delete a column, remove a comment, change the amount paid. I normally trust people but this was the only place where I was recording spends. And it’s rather easy to fuck up with a spreadsheet. So, I would make a copy of my marketing spend sheet every couple of weeks or whenever the terror struck me. Over time, I ended up with 40–50 copies of the marketing spend sheet.
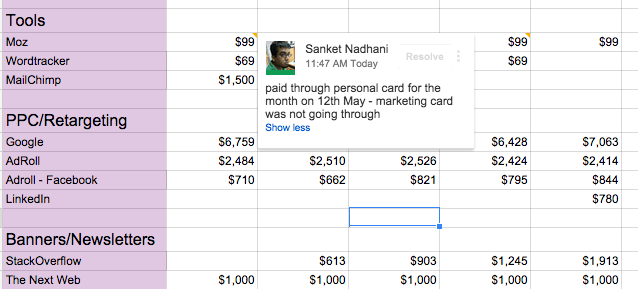
Also I often add comments to individual items with details on the campaign, the creative we ran, or simply if the campaign has already been paid for.

While comments in Google Sheets are awesome to collaborate, once you have a couple of comments, they start to get clumsy. And with 15–20 comments every month, it is easy to miss out on one of the important ones. Oftentimes, I also wanted a reminder to check on the RoI of a particular campaign or to make a payment, which was not possible in Google Sheets.
And of course, I wanted to compare and contrast the total spend against the budget, the spend previous month or the same month last year. Or even sum up and compare sub-heads like Tools, PPC or Events over a quarter or year. One of the core uses of spreadsheets is to help you add and compare numbers and I could have just written simple formulae for that (and I had some of them) but for most practical purposes, the analysis I needed to do was different most of the time. And then there were times when I just wanted the bigger picture — show the total divided under sub-heads, no need for individual expenses. Or show all items under PPC ads, we are spending too much there, so I need to figure out how we can cut down there.
All of these can be done with a spreadsheet, but it’s not the most efficient way. And there’s only so many rows and columns you can see at once in a spreadsheet.
I also talked to some other people in marketing and there were only two ways people were doing this in:
- A Google Sheet like mine or Excel Sheet that they mailed back and forth in the organization to prevent the fuck ups I was so scared of.
- Do nothing. And dig through your emails and credit card statement when the time came to put together the numbers..
There needs to be a better way for this.
The Solution
The next step before we get to the actual product definition is listing down the main actions a user could take in our marketing expense tracker. We won’t go into tiny details like inviting collaborators or editing the profile, we’ll just keep it to the actions required to solve the main pain points we just talked about.
User Actions
- Add an expense
- Add a reminder to an expense
- See total spend in the month broken down under sub-heads
- Compare spend against the budget
- Compare spend in current month against previous month or same month last year
- Compare spend under sub-heads across different time periods
- Edit an expense after it has been added
Screens
The next step I use in the process is to think about the most logical way to group these actions into screens. Here are the screens we are going to have for our expense tracker:
- Add Expense: The most obvious screen. Here’s where you can add an expense, categorize it and add a reminder.
- See All Expenses: This is where all expenses for the month will be listed in chronological order. You can see all details about a spend, edit them or delete them from here.
- Dashboard: This is where you can see total spend for the month compared to budget, and compare spends across months. Also all reminders will be shown here.
Add Expense
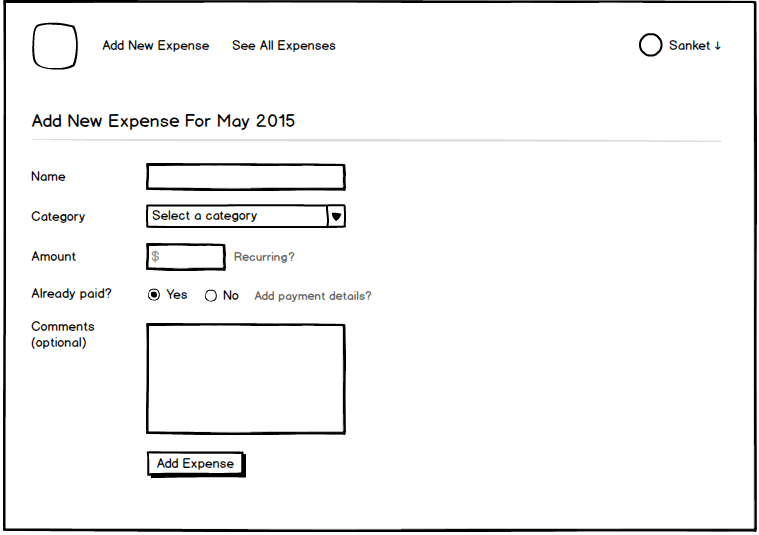
 Pretty self-explanatory but here are some pointers that the mockup doesn’t bring out:
- The name field is a textbox but once you start typing, it will show suggestions that you can pick from as well. This ensures that you don’t end up using Adwords, adwords, Ad-words for the same item, making it easier for grouping and comparison later. Of course, if you want to add a new item, you can disregard the suggestions.
- Category is to be picked from a drop-down so that you don’t end up creating too many new categories. If you want to create a new category, there will be an option in the menu. Or you can choose none if you want your item to be a sub-head by itself.
- Amount can be made recurring for things like spend on tools for SEO or email marketing, retainer contracts with agencies or long-term campaigns. It’s a pretty frequent use-case to be out there. You can choose the currency at the time of setup.
- Already paid? Then you can choose to add payment details like mode of payment and date. If not paid, you can ask to be reminded. You will get a reminder email and it will show up in your dashboard.
- Additional comments are helpful to add details on the creative you used, campaign results (later on) and so on. It really could be used in so many different ways that I cannot fathom right now, so we will have it.
See All Expenses

Additional details:
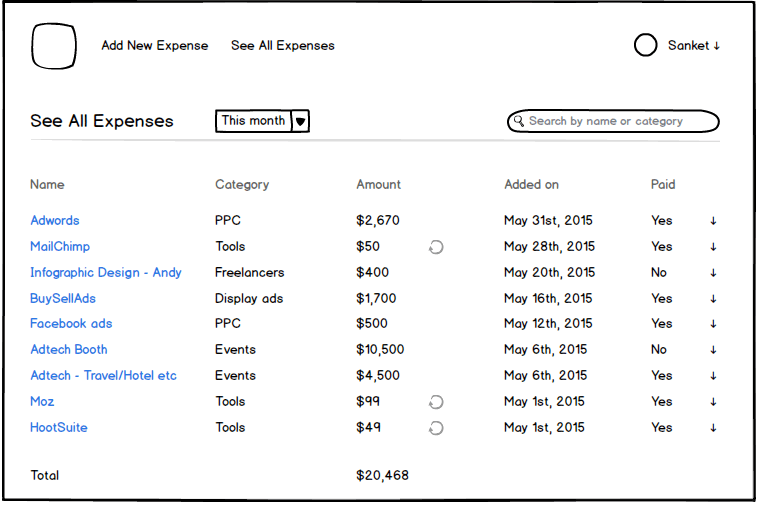
- The expenses are listed in chronological order based on the date they were added on.
- You can click on an expense to see details, edit or delete it.
- By default, you see all the spends for this month but you can also choose last month, this quarter, this year and other well-defined time periods.
- Clicking on the categories head will group all expenses under a category (see a use case for it?), the amount head will display spends in descending or ascending order and the like.
- You can also see all spends on freelancers this year by first selecting this year as the time period and then searching for freelancers in the search box. You can search for individual items as well.
Dashboard

The dashboard is rather simple.
- It shows what % of your budget for the month have you spent already. If you overshoot the budget, the bar will turn red. The budget can be set during onboarding and changed from settings for current month onwards.
- You get a quick breakdown of the spend by sub-heads right below with the option to show individual expenses under that head. Think we need it here or would people rather go to See All Expenses to see it in complete detail?
- You can compare your spend against previous month/previous quarter/any chosen time period (you are allowed to select months for this, not individual days) by using the Compare option the date picker provides (very similar to how Google Analytics has it).
- And finally at the bottom, you get payment reminders for everything that is due. If you have already paid something, you can simply check it and add payment details from the dashboard itself.
That’s it. That’s all I would build in v1 of the product..
Future Additions
Of course, I have ideas for what else can be added to the product. Who doesn’t? But as I said, I will evaluate them once v1 hits the market and I have data points on how people are using it. Here are some of the ideas:
- Simply send an email to a particular address to add an expense.
- Build a mobile app. Or probably start off as an app itself.
- Automatically pull spends on Google Adwords, Facebook Ads and everything else that can be automated.
- Show RoI for different campaigns. Again the details are a little fuzzy, but if the product could show RoI, it becomes a lot more valuable than a simple expense tracker. And a lot more embedded into the marketing team’s workflow.
- Show possible savings. If the product is tied to Google Adwords, I could show ideas on which campaigns can be optimized.
- Suggest additional channels to advertise on. You have budget left over for the month. Why not try out some additional growth areas? It’s a tricky problem to solve but a problem a lot of people have. And going from passive expense tracking to providing active suggestions makes it so much more valuable.
- Some kind of gamification or feed to show who added what expense. If people see others are adding every expense and detailing them out, they will be pushed to do it too. Adding marketing expenses, after all, is not the most exciting job on the planet.
What do you think?
Is this a pain point you or other people around you face? Does a product like this help you? If you were to build this, would you build it any differently? Or prioritize the functionalities differently? Would love to have your feedback.
Why am I doing this?
Why would I put out a pain point and then discuss how to solve it in so much detail? Why wouldn’t I just go build it?
Because coming up with the initial product idea and actually building, marketing and supporting it are completely different beasts. Moreover, I want to get better as a product person. I want to be able to identify opportunities better, learn how to tackle them better and how to prioritize what to build. As much as I tried to find detailed case studies on how other products opportunities were spotted, how they thought of the solution, the trade-offs they made, I was not able to find good study material.
I have a bunch of product ideas that I have made notes on over the years. If this post turns out well, I will do the same with them. So do add in your feedback, brickbats or bouquets and help me become a better product thinker. Thank you!
Follow me on Twitter: @sanketnadhani


